[Do you like this? Please subscribe to my YouTube Channel and then share it for me!]
Video Summary
Today we’re going to take a quick look at split testing and a simple tool — see Split Testing tool
Do you know what split testing is? Sometimes it’s called A/B testing.
Basically, split testing is a statistical way of comparing two different versions of something to see which one performs better. When applied to your website, the goal of split testing is to identify changes that increase a desired outcome.
Want website visitors to purchase or call or take some other action on your site? Then split test your way to increased performance and bigger profits. This free tool will make it easy.
Video Transcript
Hello, I’m Jeffrey Kirk. Today we’re going to take a quick look at split testing and a tool that can help.
Do you know what split testing is? Sometimes it’s called A/B testing. Basically it’s a statistical way of comparing two different versions of something to see which one performs better. When applied to your website, the goal of split testing is to identify changes that increase a desired outcome.
What that means is that you can be looking at one of your web pages and you can ask yourself a question… “Hmm. I wonder if more people would call us if we move the phone number to the upper right?” Of course, you could ask the opinion of several customers, coworkers, family, and friends, if they would prefer to see the phone number in the upper right or if it’s better to just keep it in the nice spot next to the company president’s photo.
But all you really get in that case is opinions. Do you want to run your business based on opinions, or on real data? It doesn’t matter what your customers think they like. The issue is what drives people to take action. Which position results in more phone calls?
Test the Hypothesis
Instead of just wondering, you can run a test to find out the answer. You test the hypothesis to see if there is a statistically significant change. Effectively, what you do is create an alternate version of your webpage. You create a version that satisfies the question that you’re asking.
In this example, wondering about the phone number placement, you could create a page that has the phone number moved to the upper right. At the same time, you continue to keep your current page. Now you split test them.
Each person who visits your website is given one of the two pages randomly. You don’t know which one they’re getting, and they don’t know that they’re involved in a test.
Since this example is about phone calls from your website, the person answering your phone must complete the measurement. For example, he or she could say, “Hey, thanks for calling. Just for our records, are you seeing the phone number next to Jack, our president, or is it in the upper right corner of the webpage?” And then tally the answers. The more answers you have, the more accurate the data will be.
So collect the data for at least a couple weeks, or if the phone’s ringing off the hook, do it less time. You’re collecting four pieces of information…
- the number of times someone saw the original page
- the number of times someone saw the test page
- the number of times someone called from the original page
- and the number of times someone called from the test page
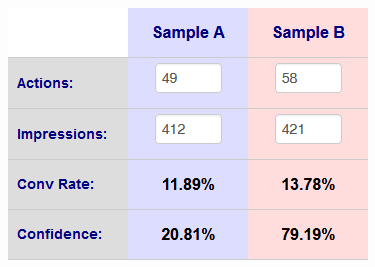
Let’s say your original web page was seen 412 times during the experiment, and the new page was seen 421 times. The pages are displayed randomly, so the totals should be kind of close to each other, but likely will vary a little bit. And you got 49 calls from the original page and 58 calls from the second.
Then simply drop those four numbers into a handy split testing calculator. And you’ll see where you stand with this test.

In this case, the conversion rate for sample B, your brilliant idea about moving the phone to the upper right corner is a little bit better than the original. The confidence is much better, about 79% compared to 21%.
How Much Confidence Do You Need?
At this point, you might be tempted to update your website to go with a new page, but first you must understand what the confidence number means. It tells you that not quite 80% of the time, this page is the better page. What that means is that nearly 21% of the time or about one in five times, changing to this page will be a mistake.
A general rule of thumb is that you want to see a confidence of 95% or higher before you commit to a change. In that case, your data gives you the wrong answer only one out of 20 times. And most of the time you can easily live with that. If being wrong one out of 20 times is too much. Then wait for higher confidence.
Of course, you get to decide your own level of comfort with the confidence number, whether it’s a potential 20% error or 5% error or 1% error rate. But it’s not just comfort level, it’s time. Getting higher confidence takes longer because more data is needed to produce statistical confidence. Can you wait long enough to reach the confidence number you want to see? For the phone number example, if you think being wrong one out to five times is acceptable. Then go ahead and implement the change.
I would suggest considering other factors first, though. If you collected all this data within days or even a week or two, then let the test run a little longer. If the ratios stay the same, then the confidence goes up. If instead the ratios change and the confidence drops, then you might be happy you waited. On the other hand, if it took a year for you to get this much data, then you have to work on getting more traffic to run through your test, or you have to accept a lower confidence.
The upside of split testing is that every time you make a change that improves conversion, you are creating a better and better website for your business. You are getting better results with more leads and more sales. You can split test your way to bigger profits.
So why not just move the phone number to the upper right without testing? Well, maybe the phone number by your company’s president makes it more visible. Maybe you get more calls simply because it’s in that position. You could move the phone number without testing, thinking that the upper right is a better spot, but then three months later, you notice your business doesn’t get as many calls as it used to. Now you don’t know why. Was it the change in phone number position, or did something else change, maybe in the economy or in your industry. Without the testing, it’s all a guess.
Real Life Example — Webinar Registrations
Here’s a real life example. And I will show you how to easily use the split test calculator to give me the data that I need. In this case, I’m comparing two separate landing pages against each other. The goal of these landing pages is to guide people to join an upcoming webinar that I’m presenting.
An ad sends people to the landing page. They are randomly assigned one page or the other, and each time a page is seen, that is an impression. If they make it to the thank you page, then they have converted. They have taken the action that I want them to take.
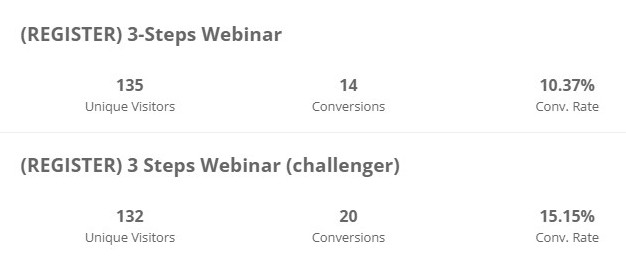
In this example, I have two pages that have the same messaging, but the layout and color schemes are different. For the control version A, there have been 135 unique visitors and 14 conversions. Version B has 132 unique visitors with 20 conversions, and here’s the link to the split test calculator that I use. It’s splittesttool.com. So let’s go there and we’ll take a look. I will show you the results of this actual test, so you can see how to use the tool and the type of results that I’m seeing.

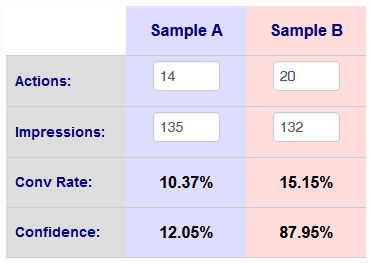
Okay. So here we are at splittesttool.com. As I had said, for sample A, for the control, there have been 135 impressions, so I’ll just put that in here, and there have been 14 conversions. For sample B, we’ve had 20 conversions with 132 unique visitors, 132 impressions. So then all I have to do after I get the four numbers in there is click on the calculate split test confidence button. So I’ll do that, wait for the results, and here’s what we get…

Now we can see the conversion rate, about 10.37 in this one and 15.15 for sample B. And that gives us the confidence, the winner. Sample B is winning with 87.95% confidence. So that means that roughly 12 out of a hundred times, sample B is going to lose. Is that acceptable or not? That really means about one in eight times, sample B is not the true winner and that if we collected more data, the results would be different.
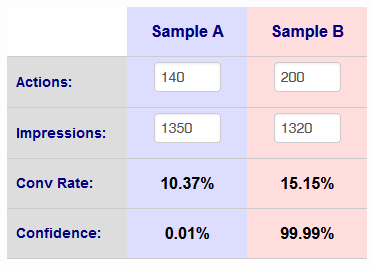
So the longer I wait, the more I’m going to get confidence. If these numbers are huge, let’s just multiply them by 10 in every number. You’ll see that the conversion rate stays the same, but the confidence changes greatly. So under this scenario, we’ve got 99.99% chance that sample B is the winner, but that’s not where our data is today.

Today we’ve got much smaller numbers so let’s go back to the numbers that we had. So now I have a decision to make. I can either go with these results, knowing that seven out of eight times, picking sample B is the correct one. If that’s enough for me, then it’s a good decision and I can move forward.
But is it? Maybe I want 90%, maybe I want 95%. In this case, I’d actually love to see 90%, but how long do I want to wait until I’m able to make a decision and choose the page? Because ultimately what I want to do is get onto the next test. I always want to be continuously testing. So I’ll make a decision and then find something else to test and make that a change, so that I’m always trying to get better and better results. And what this tool does is it gives me the ability to ask questions so that I can make good decisions for my business.
So your assignment at this point is to go to splittesttool.com and try some numbers. Even if you don’t have any real data, go ahead and put some numbers in to see what happens. And since it’s a free tool, please like or share that page. That’s all for now, have a great day.